Pages

Saturday 31 January 2015

Driving Improvement With Management Reporting

Introduction

Companies spend a lot of time and resources reporting on their businesses.  There are balanced scorecards, KPIs, executive, management and status reports done daily, weekly, monthly, quarterly and annually. Executives and managers have so many reports they have trouble reading them all and employees complain that reporting takes up more time than the jobs for which they’ve been hired. After all that, the sad fact is that many reports are read and deleted, read by the wrong people, or not read at all.
Here we’ll talk about how to streamline the number of reports produced, and how to tell the right story to the right people.

How Many Reports Are There?

Take a close look at the reporting done in your organization.  Chances are good that various departments have been turning out the same legacy reports for years and that, as new managers and executives came in, additional reports were requested - and dutifully produced - showing similar data in a slightly different view. Take a look at the reports as a whole to see if all of them are adding value.
A company I worked with went out to all the managers in the organization and asked for a list of reports they produced.  We gathered detailed information about each of the reports, including:
  • Who produced it
  • Who received it
  • What data was included in the report
  • How frequently it was produced
  • What the purpose had been when originally requested
We then took that information and did a meta-analysis of the reports.  In some cases they were duplicative and had different views of the same data.  In those cases, we surveyed the recipients of both reports to uncover their requirements and worked with them on a view to accommodate everyone who used the report.  In other cases, the recipients no longer used the reports. We reduced the time spent on reporting by combining or eliminating those categories by an estimated 35%. 
In a further step, we looked at source data and identified where reports could be automated.  In those cases, we worked with the IT department to automate the reports.  An additional benefit to the automated reports was the ability to view at various levels and allow users to choose how much detail they needed to see.

Who’s Reading the Reports?

Management and executive reporting is typically one-directional, and that direction is up. Ideally, the same data can be rolled up and cascaded upwards. But think about that information being distributed laterally, targeted to the upstream departments that may be interested in the results of their work.  Here are some examples.
  • A customer service department will produce management reports on the number of calls they received, and typically the reasons and resolutions are codified for each call.  These reports are used for tracking agent performance, and sometimes stop at the management level. A breakdown of the reason codes for all calls would be useful to the department producing the product or service.  The reports could then be used for their continuous improvement. 
  • An operational report on the performance of an online site typically includes outages, performance degradation, and volume and is read by the people responsible for keeping the services up and running. The root cause of the incidents is tracked.  A real-time report fed to the customer service department would allow the representatives to inform callers of the current situation and the expectation for resolution. Additionally, a report on the root cause might be sent back to the developers for them to gauge how many outages result from new code pushes or other changes to the underlying software.  Where hardware or software vendors were responsible, credits against their Service Level Agreements could be claimed by the those managing the vendors.
  • Budget reports are provided to managers, and include line item variances.  If the purchasing department was provided an aggregate of line items across all managers, they might spot opportunities for volume discounts or find alternate vendors for purchases that contributed to the highest variances. The staffing organization could take a look at the pay scales compared to industry standards, provide updated guidance to managers during the budget process.

Telling the Whole Story

One of the key pieces of information that often gets lost in the facts and figures may be your customers. Typically, the numbers and trends will tell management how a department is doing against their objectives. Even where the customer was in view when the metrics were designed, they are often lost by the time the reports are compressed, condensed and presented.
How can we incorporate the customer into our reports?  Let’s take the examples above and see whether there are ways to tell the customers’ side of the story.
  • In a customer service organization, we probably know from the reason code why a customer called and how the call was resolved.  Add two fields on the customer call record – their mood when they called and their mood when they hung up, as perceived by the agent taking the call.  Two lines and on the final report could tell the story. If considered a key metric by executives, it would keep the department providing the product or service focused on how the customer felt when they called, and the customer service agents focused on increasing the customer happiness factor when the caller hung up.
  • A report for an online service tells how many outages for a given period, how long they lasted, what caused them and what was done to correct them.  Adding a comparison of the typical volume at the time of the outage to the same time frame for the previous week(s) would tell the story of the opportunity cost of each outage.  Providing the number of abandoned sessions during a period of degraded service would focus on the frustration level of users who weren’t willing to wait for the site to respond, and adding a comparison of logon attempts for the same time frame the previous week(s) again provides the opportunity costs. Then, raise this as an objective in both the development and operations departments to keep their focus on the customer.
  • In budget variance reports, provide managers with context on what percentage of their variance contributed to the published quarterly or annual report, and tie it to the stock price.  Although shareholders are not direct customers, they are major stakeholders nonetheless.  Give the managers incentive not only to meet their budget targets, but exceed them. Chances are, they are shareholders, too.

Final Recommendations

To make reporting worth the time and effort a company puts into it, here are the three things you can do:
  • Look to streamline your reports so they’re telling a consistent story
  • Distribute them more broadly to drive improvement
  • And always, always include a measurement of the customer and stakeholder experience
Your executives, shareholders and – best of all – your customers will thank you.

Friday 30 January 2015

SOA and Business Processes: You are the Process!

Business Process Management is a management discipline that thrives to improve process performance. If done right, BPM leads to appealing, user-friendly processes that provide information about productivity, that measure performance and that illustrate the potential for improvement while indicating the exact location in the overall process that potentially benefits from one of various process optimization strategies.
To deal with the complexity of modeling a company's business processes, business analysts proceed hierarchically and begin by describing a value chain (process level 0) through several levels of processes, until they reach a level on which they depict a detailed description of the activities of process participants. Figure 1 gives an overview of BPM with a figure for each modeling technology and the interaction with SOA services.
We see that Business Process Management and SOA go hand in hand: SOA enables BPM.
ind-soa-mdm-fig01
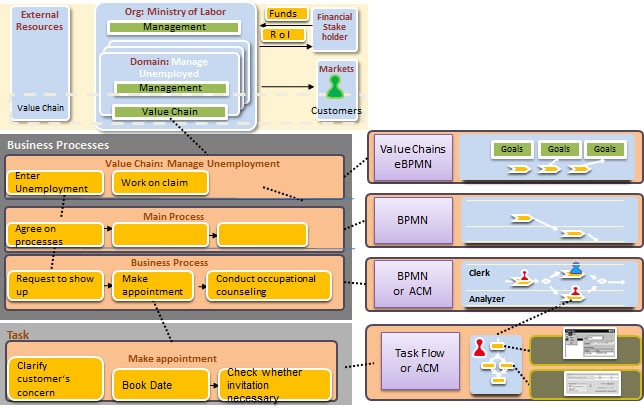
Figure 1: BPM and SOA: the bigger picture
At the highest level of the process hierarchy, the functional process blocks for end-to-end processes that potentially span departments in the overall organization are described in a high level, very abstract and coarse grained language, like IDS Scheer value chains. There is no branching, but they do include the most important business goals, ideally expressed as KPIs and other organizational aspects, such as assigning steps to departments.
At the next levels, the process steps are described hierarchically, with the level of detail increasing downward. This is done today in the lingua franca for business process models, Business Process Management and Notation (BPMN). Here the process participants or players in a process are represented as "swim lanes," which contain the process steps that are assigned to this participant.
At a middle hierarchical level (levels 1-3), the process participants are still included relatively roughly through the organizational units, such as the "Purchasing" department.
If you drill down deeper into the process details, you reach the fine-grained level (level 4), at which the activities of the process are represented through automatic system interactions via services and through human interactions These steps that are performed by individuals are called "human tasks." Tasks are specified through process participants in their task lists. The sequences within a task can be modeled and listed in detail in an enterprise portal as "page flows." Examples of human tasks are:
  • Recording of contract data by dealers or by customers themselves.
  • Manual review of a large customer contract
  • The receipt of a complaint in the call center
  • Handling of an error from a fully-automated process
When designing the human tasks, it is a good idea to distinguish the level of each process participant's expertise and adapt the screen layout accordingly.
  • For beginners, a strict requirement of a predefined sequence of linearizable mini-screens that work towards achieving the human task's goal.
  • For experts, a greater degree of freedom in the screens' layout appropriate for a modern expert system.
Once a human task's goal has been attained, a SOA service, typically a task service, is called, which writes the data that was collected during the work step transactionally into a persistent store.
Now we have described the interaction between SOA and BPM. Attentive readers will have noticed an alternative to BPMN in the figure. What is hiding behind the new buzzword ACM (Adaptive Case Management), and how does it relate to "traditional" BPM?
We begin to grasp that further increasing efficiency is no longer achieved by further automating routine tasks (that is already mapped in today's standard ERP software). It is rather a question of determining certain tasks that would benefit from the creativity and decision making abilities that differentiate us humans from algorithms. These activities, such as deciding on a customers credit worthiness or prioritizing actions to resolve a critical situation are assigned to knowledge workers. Let us investigate when this new type of process improvement strategy and according role can be applied, where it is best used to complement routine work.

Why is BPM Not Being Enthusiastically Embraced?

Champagne bottles are opened - the business unit employees are happy. They celebrate that in the new BPM project they see to their delight that in practice the process for engaging external employees is running exactly how they specified it in their sequential process model. In detail, this process comprises a variety of assessments and approvals at different management levels. The exact sequences could be very well expressed in the business process model and notation (BPMN) 2.0 modeling languages. These models are understood by everybody in the team and can be easily changed. At the same time, these models are the basis for conforming executable IT processes.
Such success stories in which a departmental workflow has been used successfully in order to improve productivity can be found in most enterprises today and suggest that BPM as whole is a success. They nurture the belief in business IT alignment through BPM. But why is BPM not being more enthusiastically embraced? Why are automated processes not finally breaking away from the limited space for improvements at micro level, or within departments, and pushing forward into the enterprise area? In part the answer lies in reluctance on changing the culture from a siloed approach in which departments are defined through their function and not through their position in the end to end process to an enterprise wide process driven approach. Yet, in the last years it became clear, that flowcharting-based approach as advocated by most current BPM solutions is not sufficient to cover all types of processes. Sometimes it's not feasible to predefine every step before running a business process. Sometimes you don't know what happens next. Sometimes it's best to rely on a human in the field in order to find the right path towards reaching a business goal.

Routine Work vs. Knowledge Work

Increasing efficiency by automating processes – human history did not need to wait for computers in order to materialize this mantra. Henry Ford and Frederick W. Taylor successfully defined a management approach that broke work down into simple tasks, to enable the complexity of the overall job to be managed. In this way, the giant task of manufacturing a car was broken down into many individual subtasks that only required a few movements each. Each production worker had to carry out precisely defined steps. There was no room for acting independently—and it wasn't necessary either.
Drawing on Taylor's vision, several authors in the field of BPM management discipline have been promoting flowcharting as a way to optimize of business processes since the 1980s. These kinds of "normative" BPM projects ideally enable business departments to analyze business processes, document them, and easily change them if needed. However this only functions well for "normative processes" whose flow can be precisely described before being executed.
In knowledge-intensive contexts, this kind of process is too inflexible to be able to map the complex reality. It would simply be too expensive, and ultimately unmaintainable, to model all conceivable variants of the process cycles, including all possible error and event conditions in advance—if you could ever really achieve completeness at all.
A further requirement for successful normative processes is that the people who take part in the process can work productively under close and strict management conditions. Today, the factory of this type of production workers isn't a physical one anymore, but a mental one: They sit in front of their computer screens, forced to go through the same old task lists and screen sequences by process "straitjackets" of predefined processes. This makes it difficult, or even impossible to work in a way that is innovative and suited to the situation.
The process participants are taken by the hand and guided through a given process, following the model. Just like workers on Taylor's assembly line, they have little scope for decision-making.
However, today we have transformed into a knowledge society. Tasks such as customer complaint management, processing damage claims, supporting job hunters, assessing legal issues, or research and development all require a high degree of dynamic reactions, due to their complex circumstances and new events which can occur unexpectedly. Big names in management such as Peter F. Drucker and Thomas H. Davenport describe the rise of the knowledge worker, who is proving to be far less controllable than the production worker.

The Evolution of BPM - From Normative to Adaptive Processes

What impacts are the differing approaches of the production worker and the knowledge worker having on the designs of BPM initiatives? Rigid, or normatively designed processes, which define precisely how a process is to run before they are executed, are suitable when the goal is to standardize work in Taylor fashion. Traditional process automation lends itself to tasks that should always be done the same way in order to standardize quality, such as preparing proposals, applying for vacation days, soliciting legal approval, maintaining IT systems, performing integration, etc. often they are not characterized by a high level of risk.
In many other cases, when things get a bit more critical and involve human decision making, potentially under pressure, normative processes are simply too rigid. It is not always clear how many steps are needed and precisely what paths you should take to reach a goal. This is true, on the one hand, for knowledge-intensive processes, but on the other hand, also for the core processes in the company for which special experts are brought in. Typical examples of this include consulting or sales meetings, assessing an accident, appraisals, and investigations. Here, the focus is on expertise and the individual choice of the subtask by the user, so as to be able to optimally conclude a business transaction.
The attempt to continue to support this kind of knowledge work with normative processes leads in reality to process bureaucracy (everything is fine if the process is complied with, even if the company makes losses), and to ultimately unproductive process instances, as it is not possible to adapt based on experience. We don't need Taylor's approach here. A BPM that supports goals, something adaptive, would be significantly more productive. We are introducing the term "adaptive processes."

Adaptive Processes as a Branch of BPM

In BPM circles, this desired behavior is called "adaptive case management" (Figure 2). You don't look at the processes themselves, but rather focus on the case for which a goal is to be reached, for which a number of possible processes or process steps, depending on the situation, can be executed. Such a case could be anything: an insurance case, a patient, a project, an asset (such as a building), a customer inquiry, or even the entire customer. We consider the term "case" to be too limiting, and are therefore expanding it to include any kind of activity that requires a knowledge worker to be flexible.
In books and the blogosphere you will often find a debate on BPM versus ACM. We motivate instead that BPM is a cross-management discipline that aims to optimize processes. "Normative BPM" (nBPM) and "adaptive BPM" (aBPM) represent two equal approached under the umbrella of BPM, and are therefore useful tools in the toolbox of business and IT architects, which are used depending on the environment and the forces. A process can contain "island" of structured flows and other islands of rather less structured combination of activities. Even then, an ACM island might contain a Flowchart island.
ind-soa-bpm-fig02
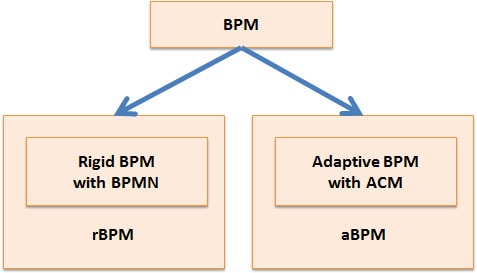
Figure 2: ACM and BPMN are variants of BPM
ACM is a sign for a recognition that IT evolves into providing knowledge workers with an optimal workplace that allows them to make the best possible decisions for the company. This means that people have to be the focus of business process management initiatives again—as participants in the process that are not fully controlled by the process model, but contribute actively and directly to the improvement. We do recognize that this kind of new twist that is not applicable for all works scenarios. Typically it is best used for aspects of business processes that that are not fully standardizable and provide a high degree of risk. An example is the credit decision process in banks. Depending on the type of the credit, this can be a highly standardized process or a rather adaptive type in which the decision-maker is provided with a high degree of autonomous decision-making authority, that will be prohibitive for the highly structured simply credit products.

Modeling Adaptive Processes

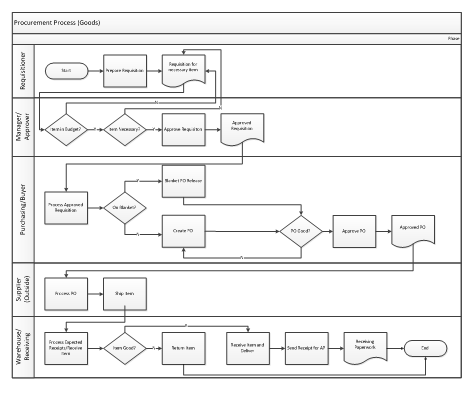
The basic idea behind the traditional BPM procedure, here referred to as normative processes, is that a process is a previously defined sequence of activities. All transitions between activities are also predefined. The gateways to processes are based on automatically executable business rules. Human interaction is through entries in work lists, through which the process participants are assigned tasks. All conceivable variants of the process are defined through the gateways (BPMN gateways). It is impossible to proceed in a way that diverges from the overall process model. Figure 3 illustrates this.
ind-soa-bpm-fig03
Figure 3: BPMN processes precisely describe the work with algorithms
But what happens with adaptive processes? Does chaos rule? How can the business department ensure knowledge workers have free rein, but still perform essential tasks? Adaptive processes do not in any way mean that everything should be left to the user—there are simply more degrees of freedom. Here too activities are defined, but there is the option that allows workers to adaptively incorporate additional human tasks. The transitions between the activities are also not modeled in a fixed way, but are determined at runtime by the individuals taking part in the process. If necessary, they are also supported by rules that can be declared as preconditions. These rules recommend users a list of conceivable activities and tools for the current context.

Living Knowledge

Adaptive processes are in a permanent state of learning and developing. This is what makes them stand out from ad-hoc or dynamic processes, which give the user a great deal of freedom in the form of arbitrarily executing steps or predefined sequences, but do not have any built-in means for optimizing through experience in the process. Adaptive processes give knowledge workers the possibility of defining additional process steps driven by the situation. This helps them to expand the knowledge base and thereby to generate sustainable added value. This results in a permanent adaptation to reality. Despite all the freedom, the path that process participants take is logged, as a basis for permanent process optimization by business units and IT. In particular, suggestions for improvements by the process participants are logged and regularly assessed. This is referred to as model afterwards or design by doing. The ultimate process arises after the fact out of the diversity of the specific instances that have been run.
An essential property is that the semantic relationship between process steps can only be defined to a very limited extent, according to the system of rules that is contained in the BPMN language instructions. These rules also only apply to steps that follow on from each other, in other words it is not possible to express the relationship of remote steps ("Only execute step 19 if step 4 was not run").
Here ACM potentially offers a fundamentally more productive opportunity to describe the technical details of processes. An ACM model describes the semantic relations that activities have with each other. These types of relations express whether an activity must, or can, be completed in advance. These activities are not automatically processed at previously defined times and places in the process pattern on the basis of a process model. Rather, all activities are made available to users as proposals and users can then decide whether and when they make use of them. The model can also be used to specify that a subsequent activity must always be executed after a certain activity. This means that it is possible to map the regulatory policies of an enterprise and, at the same time, to give users the greatest possible degree of freedom. Several approaches to such kind of ACM modeling emerge, with OMG's CMMN, Case Management Modeling and Notation, being a promising one.

Type of User Management and Interfaces

Typical user interfaces in the BPM environment comprise work lists in which users find their tasks assigned by processes. Here, small screens are often supplied for data input in the individual tasks, displayed in a generic UI area.
User interfaces for adaptive processes also provide knowledge workers with a more flexible IT support. Here there are of course also task lists—but the focus is not on executing one small micro step in a large process sequence, but rather on the complete activity. This means we tend to find interfaces which are more like portals, representing an aggregated overall view of the case. For example, all the assigned master data, histories, and previous business cases can be found here. If it is a patient system, you, as the patient, are the "case," including your entire medical history, all examinations on file, examination reports, X-rays, etc. This makes it clear that accessing unstructured data, such as on a document management system, is an important feature of the interface. However, social and collaborative features and generally all activities that could be meaningful in the context, should also be available at all times. Then there are situations in which the process participant needs to create a new activity that has not been anticipated and where no software exists at all. This is an ad hoc activity, imposing the need for ACM tools that allow to adaptively add new activities to the case that were previously not considered.

Reclaim the Grey Zone

Adaptive Case Management is still evolving. We just start to grasp the future of work. This is a future in which we decide whether algorithms take control over important decisions such as a credit worthiness check or whether we reclaim the grey zone, the moment in which the algorithm says "maybe" and leave the final word to the human expert.

Wednesday 28 January 2015

How SharePoint 2010 Can Support Non-Linear Business Processes

One thing I’ve learned as a consultant, observing the business processes at my clients’ companies and at my own company:
Not all business processes look like this:
Blog_simple_process

Some of them look like this:
Blog_complex_process_night-cycle                                                  (see end of blog for diagram credits)
A process like the one above probably doesn't need to be so complicated, but many processes are inherently complex and cyclical in nature, without the comfort of that “End” terminus in the flow chart.
Yet most of the organizational measurements in place, and the terms we use, reflect linear thinking.  The account executives “close” business (when isn’t it really the case that they’re just at the beginning of a long and evolving relationship with the client or customer?).  Opportunities move through a defined pipeline of stages (although the work product generated around them may be leveraged and improved upon again and again).  Projects are planned in a string of dependencies, and financial systems key off their start and end dates (when the reality is that controlling activities, like project management, are difficult to build into a project plan, and the lessons learned and resulting methodology improvements that influence the way the next project is run usually don’t fall under a billing code).
In October 2009, I heard Daniel W. Rasmus talk about non-linear work in a presentation on the Business Case for Social Computing at the SharePoint Conference in Las Vegas.  He said “We don’t have a language to describe non-linear work; we’re still in the industrial age.  We talk about productivity and efficiency – hospitals talk about moving patients through the system – but doctors answer they want “healthy patients.”  This is not a linear process.”
What are the “healthy patients” in your organization?  How do you work toward the strategic goals that may be vague, circular, iterative, or amorphous, but still critically important?  And how can the tools at your organization support this effort?
Here are some examples of nonlinear business processes I’ve seen, which may include finite sub-processes, but which don’t have a true end point:
- Building a brand
- Developing business strategy
- Ensuring happy customers
- Recruiting
- Cost containment
- Innovation
- Creating buzz
- “Going Green”
- Encouraging diversity
- Seeking business opportunities
- Increasing market share
- Employee performance reviews (These are often treated as linear – I work for a period of time, I fill out a long and tedious form, I meet with my supervisor and have a review, the review gets filed, end of process - but in an ideal world they’d be a continual exchange of feedback, growth targets, recognition, and  improvement.Rypple has the right idea here.)
Let's take building your company's brand as an example.  This is a long-term activity that may shift and change over time, but requires investment over the life of the organization.  Following is a list of ideas of how SharePoint 2010 components could be used to support this:

Blog of Great Ideas where the team can brainstorm and collect concepts, including partnering or co-branding ideas
Wiki of what your competitors are doing to build their brands
Web analytics reports / graph of activity on your public-facing website
Calendar of upcoming events, branding team meetings, and important dates (product releases, etc)
Image library or slide library to hold screen shots of the company's Twitter, LinkedIn, Facebook pages - to show visually the increase in followers over time
Task list to collect action items from meetings and approved Great Ideas
User tags on internal content to reflect changing trends, topics, directions
User tags on external content – e.g. “competitor,” “viral,” “inspiration”
Noteboard / activity feed of what the team is doing at any moment to build the brand
RSS feeds of mentions of your company in the press and on social media sites
Document libraries for meeting notes, strategy documents, presentations
Links to customer interactions - surveys, testimonials
Links to Marketing, Sales, and Corporate Communications within the organization,for collateral, product images, logos
Custom list serving as an index of resources - books, websites, reports on brand-building (this could be an Access database exposed through SharePoint if your library is large and complex)
Contact list of experts within and external to the organization (for example, include the individual  responsible for your product or delivery quality)
Blog or wiki of ideas around internal marketing - the initiatives that will help the entire organization understand the brand values and positioning.
- And, if you're collaborating with an external marketing consultant, PR firm, or communications vendor, an extranet site where collaboration could happen with these external contributors. 
Just brainstorming that list got me so inspired that I want to go build this site right now!  (I know, I know, If I love SharePoint so much, why don't I marry it?)  There are so many possibilities beyond the ones I've explored here. 
I'd love to hear from others:
- What are the non-linear processes you need to support in your own organization?
- Which tools (in SP 2010, other ECM systems, or web 2.0 sites) are you looking at to support them?
Drop me a comment and let me know!
Credits for the business process flows above:
BP Trends for the simple diagram:

Richard Ziade at Basement.org for the complicated diagram:

Tuesday 27 January 2015

Metrics and Business Process

I learned the importance of metrics and predictive analysis from an unlikely source in an odd place — the McDonald’s near my college — yes, the place with the golden arches! When I started working there, I didn’t know about Ray Kroc or his revolutionary idea about portion control. I simply wanted to earn money to cover my car and insurance payments.
Everything was measured at this store, from how long the fries were blanched to how long burgers were grilled to the amount time food was allowed to wait in the warming area. In addition to the process measurements, the store’s managers and assistant managers were responsible for recording the day, the date, the weather, special events within a ten mile radius, hourly sales from each register, hourly numbers for each item sold, and amount of items sent to waste each hour.
After three months of working the register, I was promoted to assistant manager and discovered the rationale behind all of the recordkeeping at the store. We had timers set for every step of the French fry preparation due to a taste study conducted some years earlier. Our great tasting fries were the result of a highly researched and test process that was optimized at every step. The proof of that was even people from nearby towns visited our store just to get an order of fries, sometimes two or three.
All of the weather, event, items, and sales recordkeeping was designed to help the managers and their assistants perform the function of “calling the bin.” It was each manager and assistant manager’s responsibility to review the previous three years’ records for that day, the previous day, and the subsequent day at the beginning of a shift. The purpose of this activity enabled a more accurate “calling of the bin.” Accuracy was crucial as fifty percent of the performance rating for managers and assistant managers was based upon their ability to “call the bin” accurately and keep hourly waste to less than five percent of hourly sales. Managers who could interpolate the past data and make good predictions based upon their research received better ratings and raises.
My introduction to measured and managed processes and prediction analysis was as practical as it was illuminating. It’s been difficult over the years to understand why enterprises neglect these significant components of process management.

Building a Roadmap

You can’t build a roadmap if you don’t know your starting point or where you want to go. Did McDonald’s map its processes? Yes, there were descriptions and diagrams in a binder that was available to every employee in the store.
Countless business managers believe that, when it comes to process management, comprehension of the present state is unnecessary. The reasons for avoiding evaluation of process current states are as numerous as they are inventive.
“Let’s just change/fix them.”
“It’s a waste of time that’s better spent elsewhere.”
“We already have SOX §404 documentation; we don’t need anything more.”
“No one will look at these documents once they’re completed. Further there is no one to keep them updated!”
Do any of these sound familiar?
Until every participant understands the current state of a process, improvement, let alone any measurement, cannot begin. Mapping the current state of a process enables measurement of each component. Once metrics can be associated with the elements of a process, participants can evaluate which actions or improvements are most likely to result in a better process with superior results.

Mapping Format Matters

Does the format matter? The simple answer is: Yes, it can. The more critical question to ask is: What do we want or need to measure in this process? Here are some examples.
  • Duration of each step
  • Number “hand offs” in the process
  • Number or amount of required inputs or outputs
  • Number of participants
  • Amount of key controls
Different process mapping formats uncover different challenges. There doesn’t appear to be a single format that allows participants to see all of the process metrics at once.

Linear Diagrams

Linear process diagrams, also known as “time line” diagrams, display the chronological order of events in a process. A linear flow of events and tasks can also assist participants in a process with identification and measurement of areas where duration is excessive.
Fig 1
Figure 1: Linear Diagram
If an organization wants to reduce its period close cycle from five to two days, a linear diagram can help identify “time lags” in the close process.

Cross-Functional (swim lane) Diagrams

Cross-functional diagrams help participants with understanding the relationships between functions and entities. Process participants can easily review and measure “hand offs” and “decision points” and gain some insight into “moments of truth.” However, cross-functional process diagrams provide little insight regarding duration, as well as inputs and outputs.
fig 2
Figure 2: Cross Functional Diagram
If an organization wants to evaluate the key controls in a process, cross-functional diagrams provide a quick means for visually identifying controls.

SIPOC (Suppliers, Inputs, Process, Outputs, and Customers) Diagrams

This approach to process mapping provides a rounded view, i.e. inputs, outputs, tasks, suppliers, and customers, including a decent picture of “moments of truth.” It is typically more verbal, rather than graphical, and can be a very useful summary or recap of a more involved process narrative document.
Fig 3
Figure 3: SIPOC diagram example
As such, it is quite useful as a supplement to the graphical mapping tools described above. However, SIPOC charts do not afford much insight regarding chronological or functional flow. They also do not include much information about cross-functional relationships and dependencies.

“In God we trust, all others bring data.”[i]

Measurement and management may commence only when processes are mapped, steps and sub-processes are defined, and all of the participants have a grasp of the “big picture.”
Metrics, i.e. data, are the foundation of process improvement and determining the ROI of such efforts. As elements of a process are measured with quantifiable data, actions can be taken to improve and, potentially optimize that process over time.
Were processes reviewed and improved at McDonald’s? They were. For example, the company began experimenting with frozen fries in the mid-1960’s; however, it wasn’t until the early 1980’s that all McDonald’s stores, both corporate and franchise-owned, used frozen fries with a new process for blanching and frying that produced French fries that customers wanted.

Summary

Every activity in business involves a process. To innovate with processes, it is necessary to understand them thoroughly. Processes that are mapped and understood can be evaluated and the components can be measured.
Only measured processes can be effectively managed, continually improved, and creatively innovated.

Sunday 25 January 2015

What makes a good business leader?

ceo
Humility, doubt and the ability to make mistakes.
These are some of the answers I'm given to the question of what makes a good chief executive.
Since the World Economic Forum is full of them (good, bad and ugly), I reckon it's a good place to ask.
"Don't believe your own brilliance" says Arne Sorenson, chief executive of Marriot Hotels and the first non-Marriott to be entrusted with leading the company in its 88-year history.
"You need to be curious and you need to be doing more listening than talking."
"It's possible to glorify the position of CEO… it's important that they should not be the only one making the decisions. Nobody is that brilliant."
Authenticity
You need a certain amount of rebellion within the team, he says in a crushed corner of the congress centre in Davos. And if you don't, you're doomed.
He also mentions the need to be authentic. Surprising, perhaps - but apparently he's not alone in thinking that's important.
Tim Morris, professor of management studies at Oxford University, was part of a team that carried out a study into the expectations of today's CEO.
They interviewed more than 150 chief executives about their job and although they had specifically avoided the word authentic, because they thought of it as too much of a buzz-word, it kept being brought up by the bosses themselves.
"It's clearly important to them," says Prof Morris.
Arne M. SorensonYou need a certain amount of rebellion within the team says Mr Sorenson

Start Quote

Showing vulnerability sometimes as a CEO is not a bad thing, but it's not always easy”
Leah BusqueTaskRabbit
"Chief executives feel that they can't get people behind them unless they're authentic."
"The traditional way of thinking about the good leader would be that they deliver for the shareholder and they survive because they deliver profits and keep people happy.
"But, for the people we interviewed, the job of chief executive was much more complicated than that."
But, I'm wondering, isn't it authentic to deliver profits? Isn't that what the job of CEO is?
Apparently not any more.
According to Oxford University's research, chief executives nowadays feel that they have to be more approachable, engaged, and caring. Or, as one described it, the Chief Emotional Officer.
Self awareness
And Prof Morris believes there won't be a return to the 'old-style' chief executive.
Leah Busque is relatively new to the business of being the boss. In 2008, she went from being a software engineer at IBM to setting up and running the company TaskRabbit.
New to the UK, the American website helps people find someone in their area to do a job for them, and now has about 50 employees.
She says she didn't have or need any training in leadership, but that she thinks the key is that she is self-aware enough to know when to bring in other people to fill in the gaps in her knowledge.
And it sounds like she's feeling the pressure to be more human.
Leah Busque

Start Quote

It's about knowing your industry but having the ability to lead people who know more than you,”
Sim TshabalalaCo-CEO of Standard Bank
"Showing vulnerability sometimes as a CEO is not a bad thing, but it's not always easy… CEOs don't like to be vulnerable, and show their weaknesses. Actually for me, it's something I have to really think about and really force myself to do."
Establishing exactly how you do that is tricky. It's possible to try too hard.
"The worst thing you can do is go on an authenticity course", says Prof Morris.
"You need to be consistent with your values, your purpose, with what you want to do and why."
Prof Morris says the power of social media means that it's impossible to switch off and dealing with that required much more subtlety than in the past.
'Shut the door'
He says there's a feeling among the chief executives they interviewed that as soon as they wake up they're aware of their responsibility.
"You can't just say sorry that's not my problem, I'll deal with it on Monday morning. There's a sense that it's all-consuming."
But he said a trait many of the executives had was an ability to shut the door on a decision after having made it.
The other factor that the CEO report highlights is how there is increasingly a global standard to the job. The answers and expectations in Japan and Korea, were not significantly different to those in the US or Europe.
And indeed the clearest answer I got on what makes a good chief executive came from Sim Tshabalala, Co-CEO of Standard Bank, one of Africa's largest.
"It's about knowing your industry but having the ability to lead people who know more than you," he says